Key Takeaway
A CBC with differential is a single blood test that counts red cells, white cells, and platelets, and sorts the white cells into five subtypes. It is the most commonly ordered blood test in clinical medicine. Reference ranges represent the central 95% of values from a healthy population. About 1 in 20 healthy people will fall just outside the range without being unwell.
- Key red cell measures (hemoglobin, hematocrit, MCV) screen for anemia and classify it by red cell size: microcytic, normocytic, or macrocytic.
- The white cell differential helps distinguish bacterial infection (neutrophil rise), viral infection (lymphocyte rise), and parasitic or allergic conditions (eosinophil rise).
- Platelet counts outside 150–450 × 10⁹/L raise concern for bleeding (low) or clotting (high), but pseudothrombocytopenia from EDTA clumping should always be excluded first [2].
- The CBC is usually the first step. Follow-on tests, including iron studies, vitamin assays, coagulation panels, and peripheral blood smears, refine the diagnosis [4].
Introduction
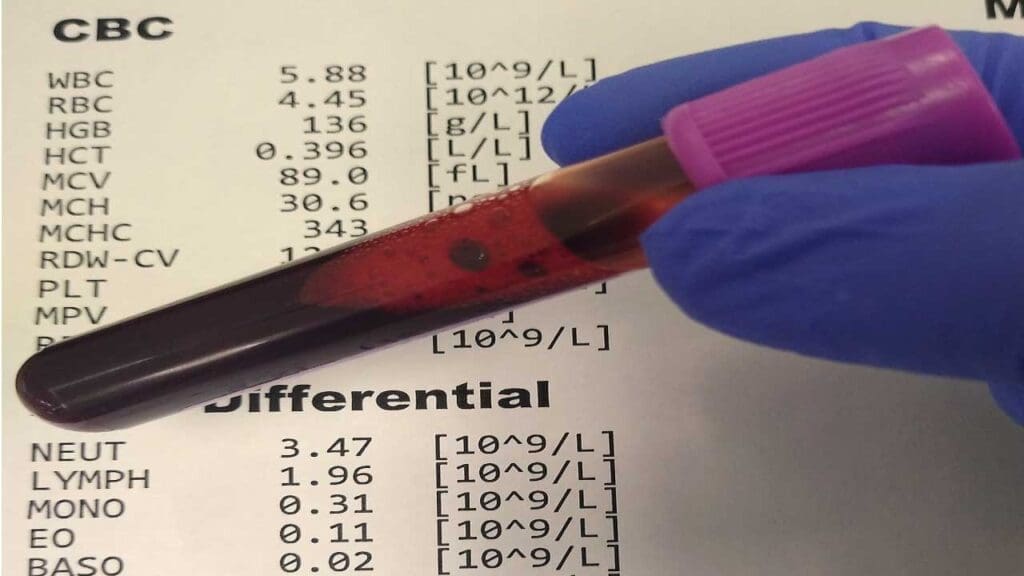
The CBC with differential is the workhorse of clinical medicine. If you have ever had blood drawn at a hospital, there is a very good chance this test was on the request form. It uses a single purple-top tube of blood to screen for anemia, infection, inflammation, bleeding disorders, and blood cancers, all at once [3].
This article walks through what each parameter means, what the reference ranges look like in adults, and which follow-on tests are commonly paired with the CBC. Numbers alone are never the whole story, so we also cover how the test is run and what can go wrong before the sample even reaches the analyzer.
How the Test Is Performed
Blood is collected into an EDTA tube (the purple-top one). EDTA is an anticoagulant that binds calcium and stops the blood from clotting. The sample is then loaded onto an automated hematology analyzer, which uses electrical impedance and flow cytometry to count and classify cells in seconds [6].
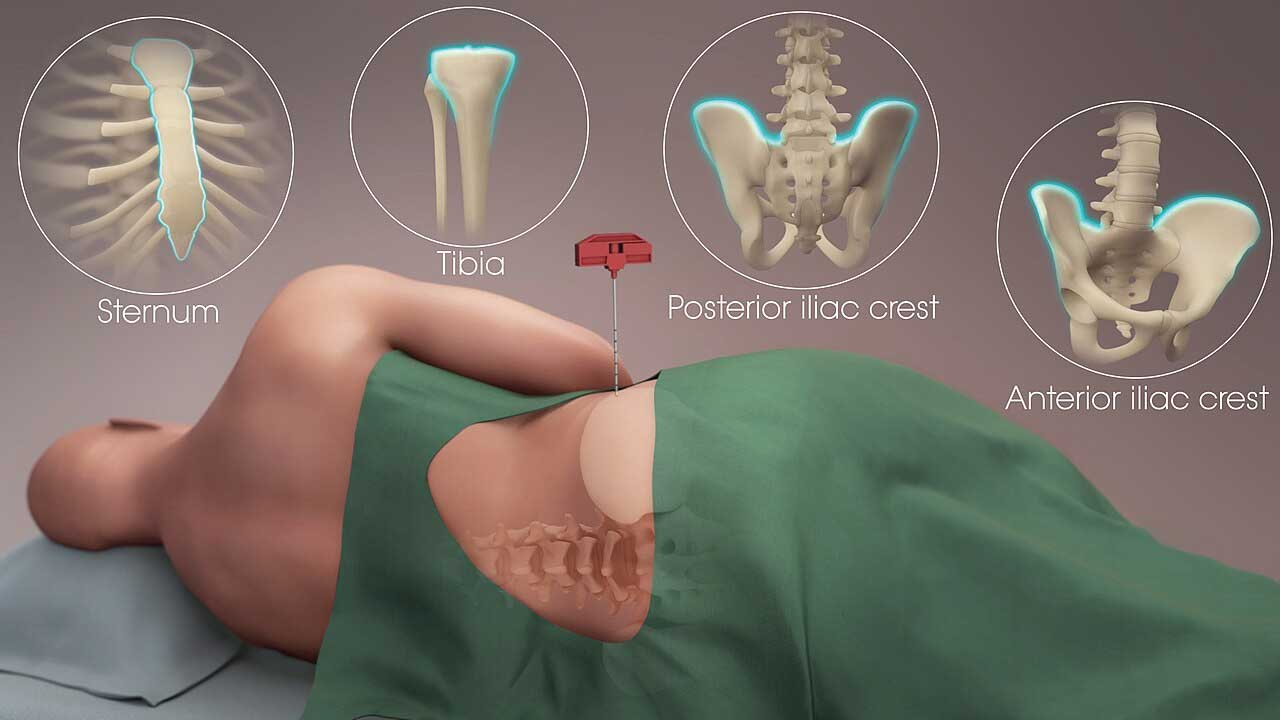
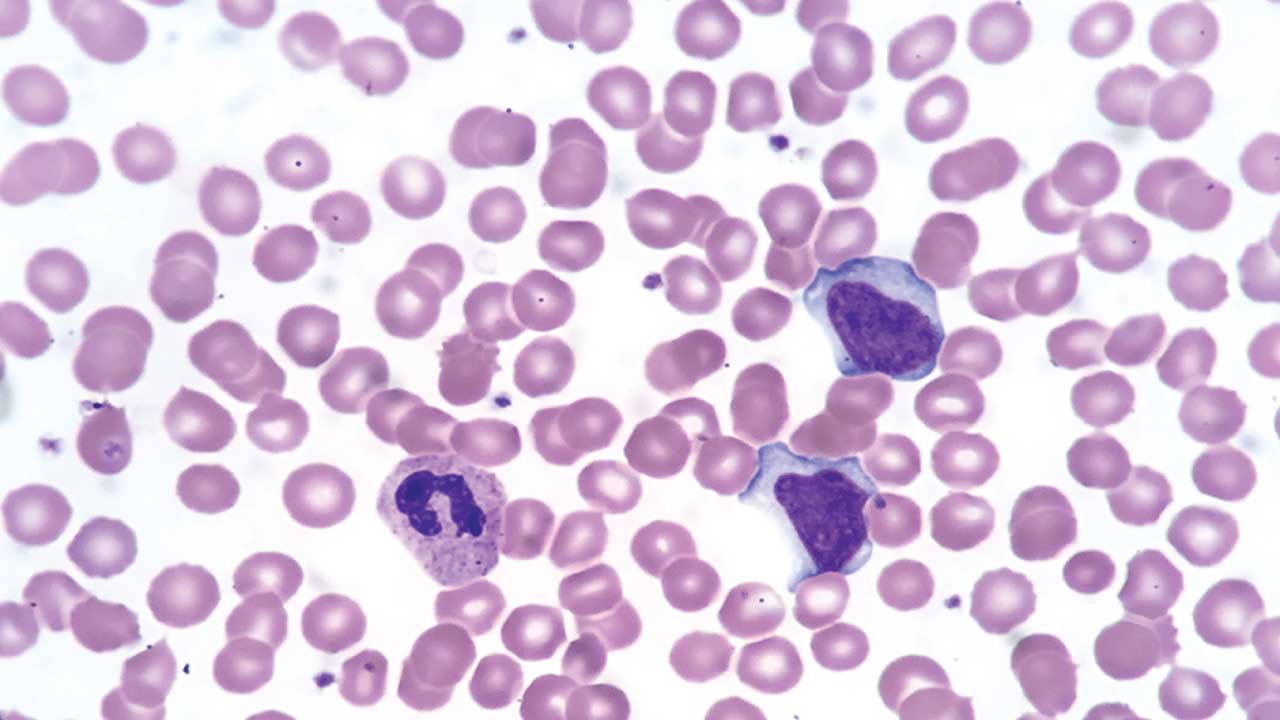
If the analyzer flags an abnormal result, a peripheral blood smear is examined under a microscope. The smear lets a hematologist or laboratory scientist confirm cell morphology and pick up details an analyzer can miss, such as schistocytes, blasts, or platelet clumps.
Pre-Analytical Pitfalls Worth Knowing
A CBC result is only as good as the sample. Watch out for:
- EDTA pseudothrombocytopenia: Platelets clump in EDTA in roughly 0.1% of patients. The analyzer reports a falsely low count. Repeat in a citrate tube before alarming the patient.
- Cold agglutinins: Can falsely raise the MCV and lower the RBC count if the sample sits unwarmed.
- Delayed analysis: White cell morphology degrades after a few hours at room temperature, complicating the differential.
- Hemolyzed samples: Lower the apparent RBC count and falsely raise plasma-free hemoglobin.
These small details are common exam questions and common reasons a result gets repeated.
Reference Ranges and What They Mean
A reference range is the interval that captures the middle 95% of test values from a healthy population. By definition, 2.5% of healthy people sit above the range and 2.5% below. A slightly out-of-range value does not equal disease. It signals "look more carefully."
Reference ranges shift with age, sex, ethnicity, altitude, and pregnancy. Newborns run high hemoglobin. Infants normally run lymphocyte-predominant differentials. Pregnant women develop a mild physiological anemia from plasma volume expansion. For example, individuals with the Duffy-null trait (common in populations of African or Middle Eastern ancestry) naturally maintain lower baseline neutrophil counts which is a benign condition now termed Duffy-null Associated Neutrophil Count (DANC) [11].
Furthermore, standard hemoglobin thresholds for anemia are inherently sex-specific; the World Health Organization defines anemia as a hemoglobin level below 12.0 g/dL for women and below 13.0 g/dL for men [10]
CBC with Differential: Adults Parameters
The CBC with differential is built from three main panels: red cells, white cells, and platelets. Each tells a different story.
Red Blood Cell (RBC) Parameters
Red blood cells (RBCs) carry hemoglobin, the iron-containing protein that binds oxygen in the lungs and releases it in tissues. The red cell parameters in a CBC with differential are designed to detect and classify anemia, a condition where oxygen delivery falls short.
- RBC count: Total red cells per liter. Low suggests anemia. High suggests dehydration or polycythemia.
- Hemoglobin (Hb): The amount of hemoglobin in g/dL. Low Hb is the defining feature of anemia.
- Hematocrit (Hct): The percentage of blood volume made up of red cells. Tracks closely with hemoglobin.
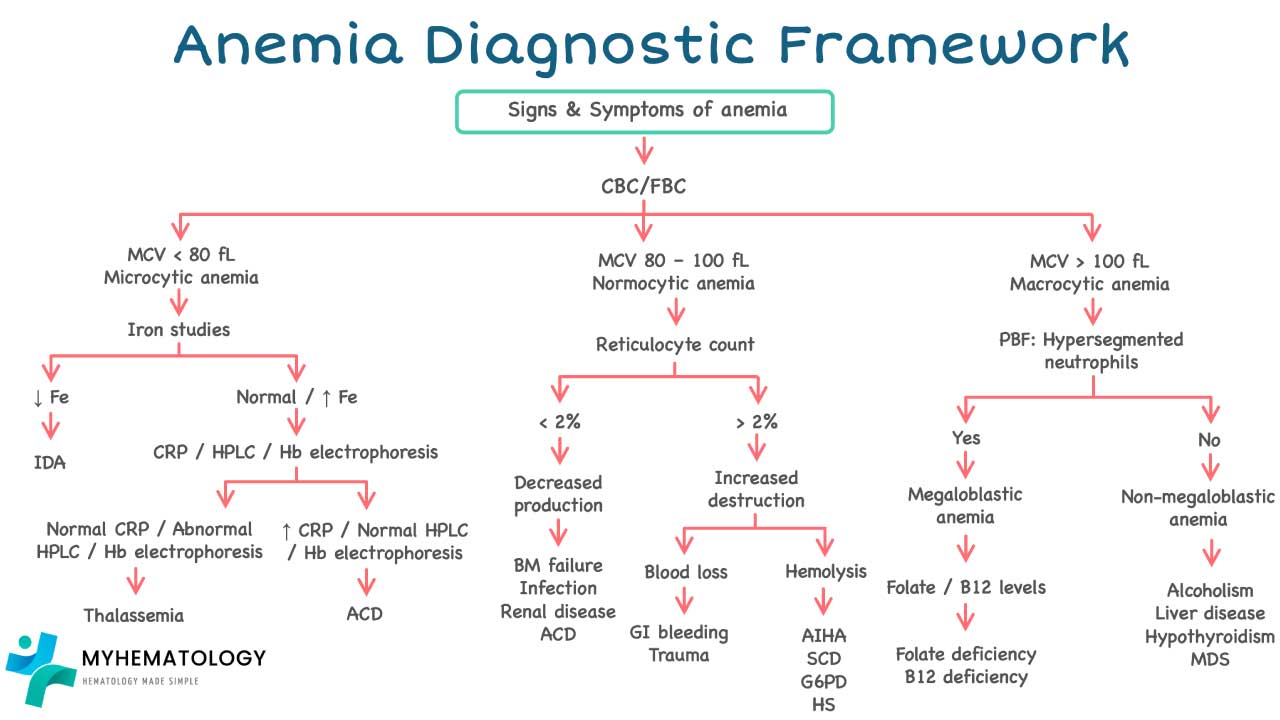
- Mean Corpuscular Volume (MCV): Average red cell size in femtoliters (fL). MCV is how clinicians classify anemia [4]:
- Microcytic (MCV < 80 fL): small cells, classically iron deficiency or thalassemia.
- Macrocytic (MCV > 100 fL): large cells, classically vitamin B12 or folate deficiency.
- Normocytic (MCV 80–100 fL): normal-sized cells, seen in hemolysis, chronic disease, or acute blood loss.
- Mean Corpuscular Hemoglobin (MCH): The average hemoglobin content per red cell, in picograms.
- Mean Corpuscular Hemoglobin Concentration (MCHC): The hemoglobin concentration per red cell. Low MCHC defines hypochromia, classically in iron deficiency.
- Red Cell Distribution Width (RDW): A measure of how varied the red cells are in size. A high RDW often appears early in iron deficiency, before the MCV drops.
- Reticulocyte count: The percentage of immature red cells. It tells you whether the bone marrow is responding to anemia.
- High retics → marrow is working overtime (e.g., hemolysis, recent blood loss).
- Low retics → marrow is not keeping up (e.g., aplastic anemia, B12 deficiency).
- The Reticulocyte Production Index (RPI) corrects the percentage for the patient's hematocrit and gives a more honest read on marrow output.
White Blood Cell (WBC) Parameters
The white cell differential breaks the total white blood cell (WBC) count into five subtypes, each pointing toward different causes of disease.
- Total WBC count:
- Leukocytosis (high): infection, inflammation, leukemia, steroid use.
- Leukopenia (low): viral infection, bone marrow suppression, autoimmune disease.
- Neutrophils (40–70%): First responders to bacterial infection. They engulf and destroy bacteria through phagocytosis (cell-eating).
- Lymphocytes (20–40%): The adaptive immune system. T cells coordinate the response and kill infected cells. B cells make antibodies. Lymphocyte rises often signal viral infections.
- Monocytes (2–10%): Large phagocytes that mop up debris and drive chronic inflammation.
- Eosinophils (1–4%): Rise in allergic reactions and parasitic infections.
- Basophils (0–1%): The least common white cell. Releases histamine in allergic and inflammatory responses.
| Parameter | Male | Female | Unit |
|---|---|---|---|
| CBC Indices | |||
| WBC Count | 4.1 – 10.3 | 4.3 – 11.7 | × 10⁹/L |
| RBC Count | 4.4 – 6.0 | 3.9 – 5.3 | × 10¹²/L |
| Hemoglobin | 13.0 – 17.2 | 11.3 – 15.2 | g/dL |
| Hematocrit | 39.8 – 51.0 | 34.7 – 45.4 | % |
| MCV | 80.7 – 96.9 | 78.6 – 97.2 | fL |
| MCH | 27.4 – 32.5 M = F | 27.4 – 32.5 | pg |
| MCHC | 31.8 – 35.2 M = F | 31.8 – 35.2 | g/dL |
| Platelet Count | 155 – 390 M = F | 155 – 390 | × 10⁹/L |
| RDW | 11.7 – 14.4 M = F | 11.7 – 14.4 | % |
| Differential (Absolute Counts) | |||
| Neutrophils | 1.9 – 6.9 | 1.9 – 7.4 | × 10⁹/L |
| Lymphocytes | 1.2 – 3.8 M = F | 1.2 – 3.8 | × 10⁹/L |
| Monocytes | 0.2 – 0.8 M = F | 0.2 – 0.8 | × 10⁹/L |
| Eosinophils | 0.04 – 0.65 M = F | 0.04 – 0.65 | × 10⁹/L |
| Basophils | 0.01 – 0.10 M = F | 0.01 – 0.10 | × 10⁹/L |
| Reticulocyte Indices | |||
| Reticulocyte Count | 35.7 – 107.5 M = F | 35.7 – 107.5 | × 10⁹/L |
| Reticulocyte % | 0.5 – 2.1 M = F | 0.5 – 2.1 | % |
Platelet Parameters
Platelets are small cell fragments essential for forming clots and stopping bleeding.
- Platelet count:
- Thrombocytosis (>450 × 10⁹/L): raises clotting risk. Causes include inflammation, iron deficiency, and myeloproliferative disorders.
- Thrombocytopenia (<150 × 10⁹/L): raises bleeding risk. Causes include reduced production, increased destruction (immune thrombocytopenia), or splenic sequestration.
- Mean Platelet Volume (MPV): The average size of platelets. High MPV suggests young, recently produced platelets, often a sign the marrow is responding to peripheral destruction.
- Immature Platelet Fraction (IPF): A newer parameter from modern analyzers. It plays the same role for platelets that the reticulocyte count plays for red cells.
Other Common Hematology Tests
A CBC with differential is rarely the end of the story. When the screening test points toward something specific, the following panels are added.
Erythrocyte sedimentation rate (ESR)
ESR measures how fast red cells settle in a tube of blood over an hour. It is a non-specific marker of inflammation. It complements the CBC by adding a global "is something inflamed somewhere" signal.
| Age | Unit | ||
|---|---|---|---|
| 17 – 50 yr | 1 – 7 | 3 – 9 | mm/hr |
| 51 – 60 yr | 2 – 10 | 5 – 15 | mm/hr |
Coagulation profile
The CBC tells you how many platelets there are. The coagulation profile tells you whether the clotting cascade actually works. They are paired whenever bleeding or clotting is in question.
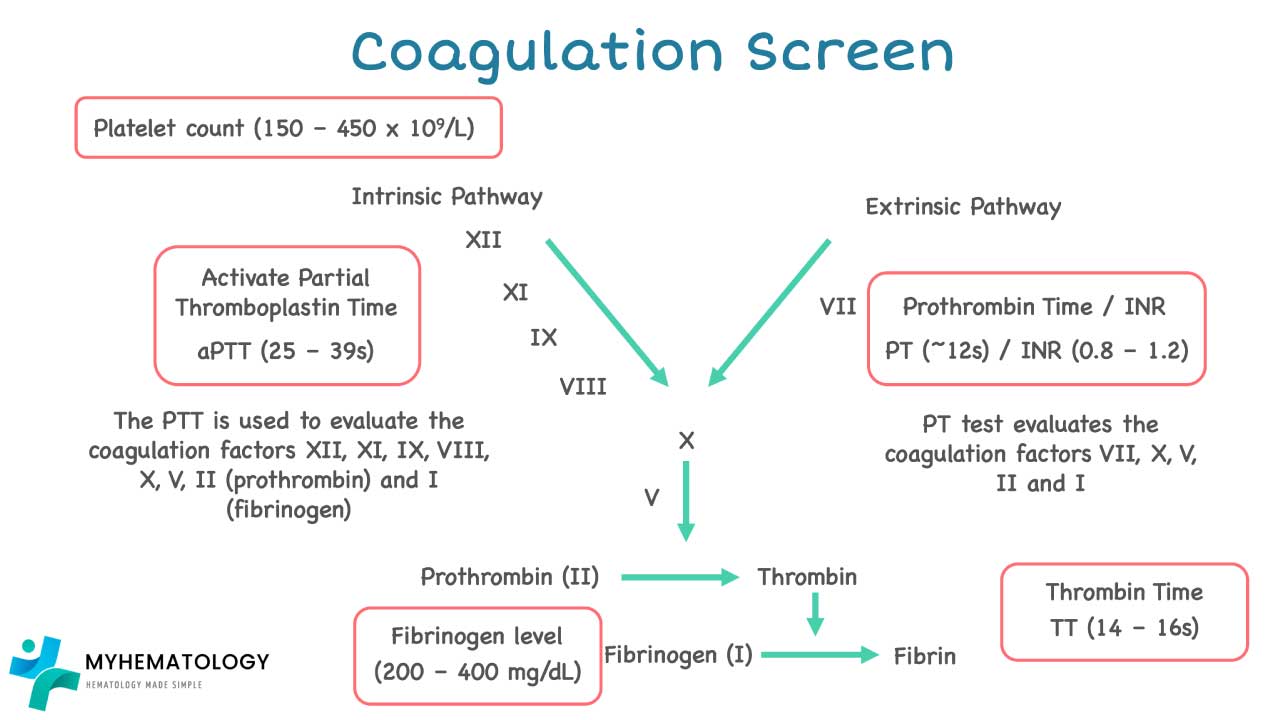
The coagulation profile, also known as a clotting profile, is a series of blood tests that assess the blood's ability to form clots and prevent excessive bleeding. It plays a crucial role in diagnosing and managing bleeding and clotting disorders.
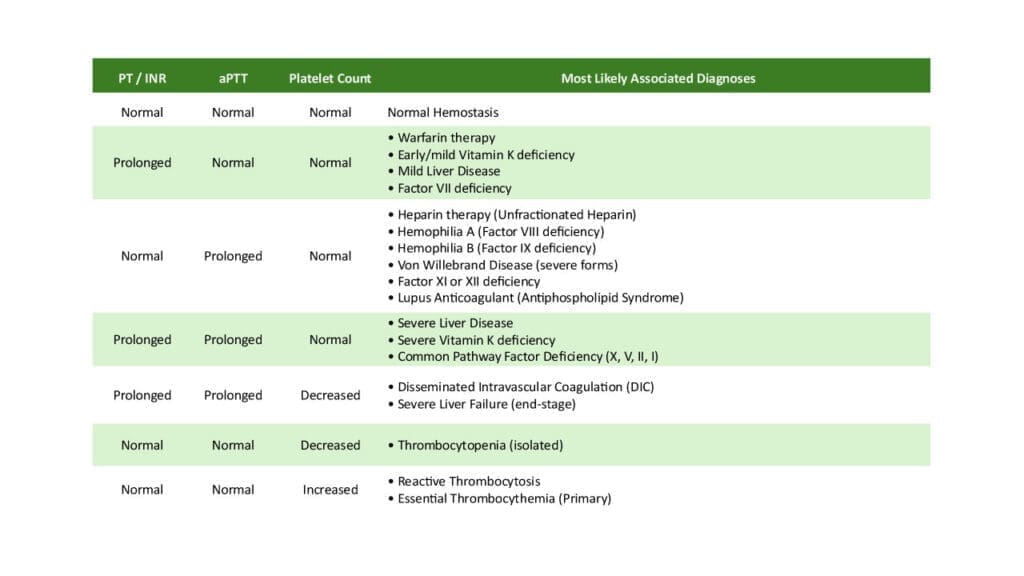
- Prothrombin Time (PT): Tests the extrinsic pathway. Prolonged PT suggests deficiency in factor VII, X, V, II, or fibrinogen. Used to monitor warfarin therapy.
- Activated Partial Thromboplastin Time (APTT): Tests the intrinsic pathway. Prolonged APTT suggests deficiency in factors VIII, IX, XI, or XII. Used to monitor unfractionated heparin.
- Thrombin Time (TT): Tests the final conversion of fibrinogen to fibrin.
- D-dimer: A breakdown product of fibrin. Useful to rule out deep vein thrombosis or pulmonary embolism in low-probability patients. In patients over 50, use the age-adjusted cutoff (age × 10 ng/mL) rather than a flat threshold; this improves specificity without sacrificing sensitivity [1,8].
- Fibrin Degradation Products (FDP): A less specific cousin of D-dimer.
- Natural anticoagulants (Protein C, Protein S, Antithrombin): Deficiencies raise clotting risk. Tested in unprovoked thrombosis.
- Specific clotting factor assays (II, V, VII, VIII, IX, X, XI, XII): Used after an abnormal PT or APTT to pinpoint the missing factor.
- Platelet aggregation and ATP release: Test platelet function rather than number. Useful when bleeding occurs despite a normal platelet count.
Coagulation & Hemostasis Reference Range
Coagulation Studies
| Parameter | Reference Range | Unit |
|---|---|---|
| Screening Tests | ||
| Prothrombin Time PT | 12 – 14 | s |
| Activated Partial Thromboplastin Time APTT | 24 – 35 | s |
| Thrombin Time TT | 12 – 17 | s |
| D-dimer DVT / PE rule-out | <500 or age × 10 if age >50 years | ng/mL |
| Fibrin Degradation Products FDP | <20 | µg/mL |
| Natural Anticoagulants | ||
| Protein C | 70 – 140 | % |
| Protein S | 65 – 140 | % |
| Antithrombin AT / AT-III | 80 – 120 | % |
| Clotting Factors | ||
| Factors II, V, VII, IX, X, XI, XII | 50 – 150 | % |
| Factor VIII FVIII:C | 50 – 200 | % |
| Von Willebrand Factor VWF activity / antigen | 60 – 200 / 50 – 160 activity / antigen respectively | % |
D-Dimer calibration difference
Results must be read in Fibrinogen Equivalent Units (FEU), as using D-dimer Units (DDU) requires a different, lower threshold to avoid misinterpretation of test results [9].
Iron Studies
Iron studies are paired with the CBC whenever a microcytic, hypochromic anemia is found.
- Serum iron: Iron currently bound to transferrin in circulation.
- Total Iron Binding Capacity (TIBC): How much more iron transferrin could carry.
- Transferrin saturation: Serum iron divided by TIBC. Low in iron deficiency.
- Ferritin: The body's iron storage protein. While the population reference range is wide, modern clinical guidelines consider a ferritin of <30 µg/L diagnostic for absolute iron deficiency, a condition affecting approximately 14% of U.S. adults [12,13].

Vitamin B12 and Folate
A high MCV on the CBC is the trigger to check vitamin B12 and folate. Both are essential for DNA synthesis in developing red cells. Deficiency causes megaloblastic anemia, in which red cells become large and immature.
Red cell folate is more reliable than serum folate because it reflects long-term status rather than recent dietary intake.
Markers of Red Cell Production and Destruction
- Soluble transferrin receptor (sTfR): Rises when cells are starved of iron. Helps separate iron deficiency from anemia of chronic inflammation.
- Haptoglobin: Mops up free hemoglobin from broken red cells. Low in hemolysis.
- Erythropoietin (EPO): A hormone made by the kidneys. Rises when oxygen delivery is poor. Inappropriately low in chronic kidney disease.
| Parameter | Reference Range | Unit |
|---|---|---|
| Iron Stores & Transport | ||
| Serum Iron | 11.5 – 30.5 | µmol/L |
| TIBC | 45.5 – 75 | µmol/L |
| Transferrin Saturation | 15 – 47.5 | % |
| Ferritin | 20 – 325 | µg/L |
| sTfR | 9 – 28 | nmol/L |
| Vitamins & Nutritional Markers | ||
| Vitamin B12 | 180 – 1000 | pg/mL |
| Serum Folate | 7 – 45 | nmol/L |
| Red Cell Folate | 300 – 1000 | nmol/L |
| Haemolysis Marker | ||
| Haptoglobin | 30 – 200 | mg/dL |
| Erythropoiesis Regulator | ||
| Erythropoietin | 4 – 19 | mU/mL |
Lymphocyte subsets
A standard CBC with differential gives you total lymphocytes, but not their subtypes. When immune function needs detailed assessment, flow cytometry measures lymphocyte subsets using surface markers.
- CD3+: Mature T cells. Low in T-cell immunodeficiency.
- CD4+: T helper cells. The classic marker tracked in HIV care.
- CD8+: Cytotoxic T cells. Kill virus-infected and tumor cells.
- CD4/CD8 ratio: A summary number. Low ratios appear in HIV and certain immunosuppressed states.
| Parameter | Reference Range | Unit |
|---|---|---|
| Absolute Counts | ||
|
CD3+ Count
Total T lymphocytes
|
694 – 2362 | cells/µL |
|
CD4+ Count
Helper T cells
|
391 – 1548 | cells/µL |
|
CD8+ Count
Cytotoxic T cells
|
185 – 1049 | cells/µL |
| Percentage of Total Lymphocytes | ||
|
CD3+
Total T lymphocytes
|
51.2 – 81.7 | % |
|
CD4+
Helper T cells
|
26.4 – 54.0 | % |
|
CD8+
Cytotoxic T cells
|
12.9 – 40.7 | % |
| Ratio | ||
|
CD4/CD8 Ratio
Helper-to-cytotoxic T cell ratio
|
0.77 – 3.93 | — |
Hemoglobin Subtypes
Hemoglobin subtypes are not on a routine CBC. They are measured by High Performance Liquid Chromatography (HPLC) to investigate suspected hemoglobinopathies such as sickle cell disease and thalassemia. An elevated HbA2 supports beta-thalassemia trait. Persistent HbF can flag certain inherited conditions or hemoglobin switching disorders.
| Parameter | Reference Range | Unit |
|---|---|---|
| HbA | 96.1 – 99.0 | % |
| HbA2 | 1.6 – 3.5 | % |
| HbF | 0.0 – 1.4 | % |
When to Repeat or Escalate
Not every abnormal CBC needs immediate action. A few practical rules of thumb:
- Mildly abnormal, no symptoms: Repeat in 1–4 weeks. Many one-off abnormalities normalize.
- Isolated thrombocytopenia, no bleeding: Rule out EDTA pseudothrombocytopenia with a citrate-tube repeat.
- New cytopenias in two or more cell lines: Refer for hematology review and consider bone marrow studies.
- Blasts on the differential or a flag from the analyzer: Always triggers a peripheral smear and, usually, a hematology referral.
The CBC with differential is the start of a workup, not the verdict. Persistent unexplained changes deserve a closer look [4].
Summary
The CBC with differential is fast, cheap, and surprisingly informative. It screens for the most common hematologic problems and points the way toward more specific tests when something looks off. Once you know how to read one, you have a foundation for almost every other lab investigation in medicine.
Frequently Asked Questions (FAQs)
What is a CBC with differential, and why is it ordered so often?
A CBC with differential is a single blood test that counts your red blood cells, white blood cells, and platelets, then breaks the white cells into their five types: neutrophils, lymphocytes, monocytes, eosinophils, and basophils. It is ordered for nearly every hospital admission and most routine checkups because it screens efficiently for anemia, infection, inflammation, bleeding problems, and blood cancers in one tube of blood.
Do I need to fast before a CBC with differential?
No. Eating and drinking do not affect red cell, white cell, or platelet counts. Fasting is only needed if the CBC is bundled with a glucose or lipid panel, in which case you would fast 8 to 12 hours per the other test's instructions.
What does it mean if my CBC results are slightly outside the reference range?
A reference range is built from the central 95% of a healthy population, which means about 1 in 20 healthy people will fall slightly outside it. A small abnormality on a single CBC is usually not alarming on its own. Clinicians look at the trend over time, your symptoms, and other tests before drawing conclusions.
Can a CBC with differential diagnose cancer?
Not on its own. A CBC can raise suspicion of leukemia or lymphoma when it shows extreme cell counts, very low counts in multiple cell lines, or unusual immature cells. Confirmation always requires a peripheral blood smear, flow cytometry, and usually a bone marrow biopsy.
How long do CBC results usually take?
Modern automated analyzers produce a CBC with differential in minutes. Most hospital labs report results within 1 to 2 hours of the sample arriving. If a manual peripheral smear review is triggered, results can take a few hours longer.
My platelet count came back very low but I have no bleeding. Should I worry?
Not necessarily. A common cause of an isolated low platelet count is EDTA pseudothrombocytopenia, where platelets clump in the collection tube and the analyzer miscounts them. Labs typically repeat the test using a different anticoagulant (citrate tube) before treating the result as real. If the repeat is also low, your clinician will investigate further.
Glossary of Related Medical Terms
- CBC with differential: A blood test that counts red cells, white cells, and platelets, and breaks the white cells into their five subtypes. The most commonly ordered blood test in medicine.
- Anemia: A condition where the blood does not carry enough oxygen, usually because hemoglobin or red cell numbers are low.
- Hemoglobin (Hb): The iron-containing protein inside red blood cells that binds oxygen.
- Hematocrit (Hct): The percentage of blood volume made up of red blood cells.
- Erythropoiesis: The process of making new red blood cells, which happens in the bone marrow.
- Reticulocyte: A young, almost-mature red blood cell. Counting them tells you how hard the bone marrow is working.
- MCV (Mean Corpuscular Volume): The average size of a red blood cell.
- Microcytic / Macrocytic / Normocytic: Small / large / normal-sized red blood cells.
- Leukocytosis / Leukopenia: A high / low total white blood cell count.
- Neutrophil: The most common white blood cell, the body's first responder to bacterial infection.
- Lymphocyte: A white blood cell of the adaptive immune system, including T cells and B cells.
- Thrombocytopenia / Thrombocytosis: A low / high platelet count.
- Hemostasis: The process of stopping bleeding through clot formation.
- Phagocytosis: The "eating" of foreign particles or cells by immune cells like neutrophils and monocytes.
- EDTA: The purple-top tube anticoagulant used for CBC samples; it stops clotting by binding calcium.
- Pseudothrombocytopenia: A falsely low platelet count caused by EDTA-induced platelet clumping, not a real bleeding risk.
- Reference range: The interval that captures the central 95% of values from a healthy population.
Disclaimer: This article is intended for educational and informational purposes only. It is not intended to be a substitute for informed professional medical advice, diagnosis, or treatment. While the information presented here is derived from credible medical sources and is believed to be accurate and up-to-date, it is not guaranteed to be complete or error-free. This article does not provide exhaustive information on all aspects of the discussed hematological disorders, and new research and understanding may emerge over time. See additional information.
References
- Konstantinides, S. V., Meyer, G., Becattini, C., Bueno, H., Geersing, G. J., Harjola, V. P., Huisman, M. V., Humbert, M., Jennings, C. S., Jiménez, D., Kucher, N., Lang, I. M., Lankeit, M., Lorusso, R., Mazzolai, L., Meneveau, N., Áinle, F. N., Prandoni, P., Pruszczyk, P., Righini, M., … The Task Force for the diagnosis and management of acute pulmonary embolism of the European Society of Cardiology (ESC) (2019). 2019 ESC Guidelines for the diagnosis and management of acute pulmonary embolism developed in collaboration with the European Respiratory Society (ERS): The Task Force for the diagnosis and management of acute pulmonary embolism of the European Society of Cardiology (ESC). The European respiratory journal, 54(3), 1901647. https://doi.org/10.1183/13993003.01647-2019
- El Brihi J, Pathak S. Normal and Abnormal Complete Blood Count With Differential. [Updated 2024 Jun 8]. In: StatPearls [Internet]. Treasure Island (FL): StatPearls Publishing; 2026 Jan-. Available from: https://www.ncbi.nlm.nih.gov/books/NBK604207/
- George-Gay, B., & Parker, K. (2003). Understanding the complete blood count with differential. Journal of perianesthesia nursing : official journal of the American Society of PeriAnesthesia Nurses, 18(2), 96–117. https://doi.org/10.1053/jpan.2003.50013
- Tefferi, A., Hanson, C. A., & Inwards, D. J. (2005). How to interpret and pursue an abnormal complete blood cell count in adults. Mayo Clinic proceedings, 80(7), 923–936. https://doi.org/10.4065/80.7.923
- Buoro, S., Mecca, T., Azzarà, G., Apassiti Esposito, S., Seghezzi, M., Vavassori, M., Crippa, A., Marchesi, G., Castellucci, E., Ottomano, C., & Lippi, G. (2015). Extended leukocyte differential count and C-reactive protein in septic patients with liver impairment: diagnostic approach to evaluate sepsis in intensive care unit. Annals of translational medicine, 3(17), 244. https://doi.org/10.3978/j.issn.2305-5839.2015.09.41
- Briggs, C., Longair, I., Kumar, P., Singh, D., & Machin, S. J. (2012). Performance evaluation of the Sysmex haematology XN modular system. Journal of clinical pathology, 65(11), 1024–1030. https://doi.org/10.1136/jclinpath-2012-200930
- Naz, A., Mukry, S. N., Shaikh, M. R., Bukhari, A. R., & Shamsi, T. S. (2016). Importance of immature platelet fraction as predictor of immune thrombocytopenic purpura. Pakistan journal of medical sciences, 32(3), 575–579. https://doi.org/10.12669/pjms.323.9456
- Righini, M., Van Es, J., Den Exter, P. L., Roy, P. M., Verschuren, F., Ghuysen, A., Rutschmann, O. T., Sanchez, O., Jaffrelot, M., Trinh-Duc, A., Le Gall, C., Moustafa, F., Principe, A., Van Houten, A. A., Ten Wolde, M., Douma, R. A., Hazelaar, G., Erkens, P. M., Van Kralingen, K. W., Grootenboers, M. J., … Le Gal, G. (2014). Age-adjusted D-dimer cutoff levels to rule out pulmonary embolism: the ADJUST-PE study. JAMA, 311(11), 1117–1124. https://doi.org/10.1001/jama.2014.2135
- Favresse, J., Lippi, G., Roy, P. M., Chatelain, B., Jacqmin, H., Ten Cate, H., & Mullier, F. (2018). D-dimer: Preanalytical, analytical, postanalytical variables, and clinical applications. Critical reviews in clinical laboratory sciences, 55(8), 548–577. https://doi.org/10.1080/10408363.2018.1529734
- Freeman AM, Zubair M. Anemia Screening. [Updated 2025 Feb 17]. In: StatPearls [Internet]. Treasure Island (FL): StatPearls Publishing; 2026 Jan-. Available from: https://www.ncbi.nlm.nih.gov/books/NBK499905/
- Murtough, S., Stellakis, O., Mills, D., Bjourson, B., Chaplin, V., Chauhan, D., Chipp, B., Cotic, M., de Villiers, J., Dzahini, O., Elmslie, F., Evans, K., Gandhi, S., Hughes, D. A., Jin, H., Panconesi, D., Skowronska, A., Sisodiya, S. M., Silva, E., Stinton, V., … Bramon, E. (2026). ACKR1/Duffy-null genotype testing for clozapine: A guideline developed by the UK Centre of Excellence in Regulatory Science and Innovation in Pharmacogenomics (CERSI-PGx). British journal of clinical pharmacology, 10.1002/bcp.70576. Advance online publication. https://doi.org/10.1002/bcp.70576
- Benson, A. E., Shatzel, J. J., Ryan, K. S., Hedges, M. A., Martens, K., Aslan, J. E., & Lo, J. O. (2022). The incidence, complications, and treatment of iron deficiency in pregnancy. European journal of haematology, 109(6), 633–642. https://doi.org/10.1111/ejh.13870
- Auerbach, M., DeLoughery, T. G., & Tirnauer, J. S. (2025). Iron Deficiency in Adults: A Review. JAMA, 333(20), 1813–1823. https://doi.org/10.1001/jama.2025.0452